
Journey dashboard
Developed a comprehensive system to monitor customers across the platform. Successfully built audiences to improve content targeting. Conducted a series of experiments within the app. Successfully launched a cross-channel campaign.
Collaborate across the organizations to deliver the best possible service to our customers, regardless of their avenue of engagement. We have several Digital and non-digital channels and touchpoints we are currently utilizing to engage with our customers. However, Most of those channels are either tracked independently or are not being tracked at all. Each division focuses on its own targets/goals and needs, so its metrics only show a small portion of the customer journey. Marketing mainly focuses on Registration at this time and there is limited data or specific sources designed to show us what triggers the user to become an active customer and continue engagement.
“80% of registrants make us no money.”
Therefore, we need to realign the flow of customers using qualitative and quantitative data from all of our domains to drive supplier acquisition, activation, and retention. We will utilize the CDP to push data into Redshift so that comprehensive data across the customer journey can be surfaced in dashboards and utilized by various domain teams (DS, Marketing, Sales, Product, etc).
Business Case
User Journey mapping provides C2FO with quantifiable data that can be leveraged for a multitude of solutions and revenue-generating initiatives. In order to quickly and efficiently understand the current workflows of our users, we can build Journeys in Segment to track and monitor what our users are doing within our system. Today, are not proactively capturing this data and thus the emails we are sending our users are purely transactional and provide little guidance or opportunities for increased engagement.
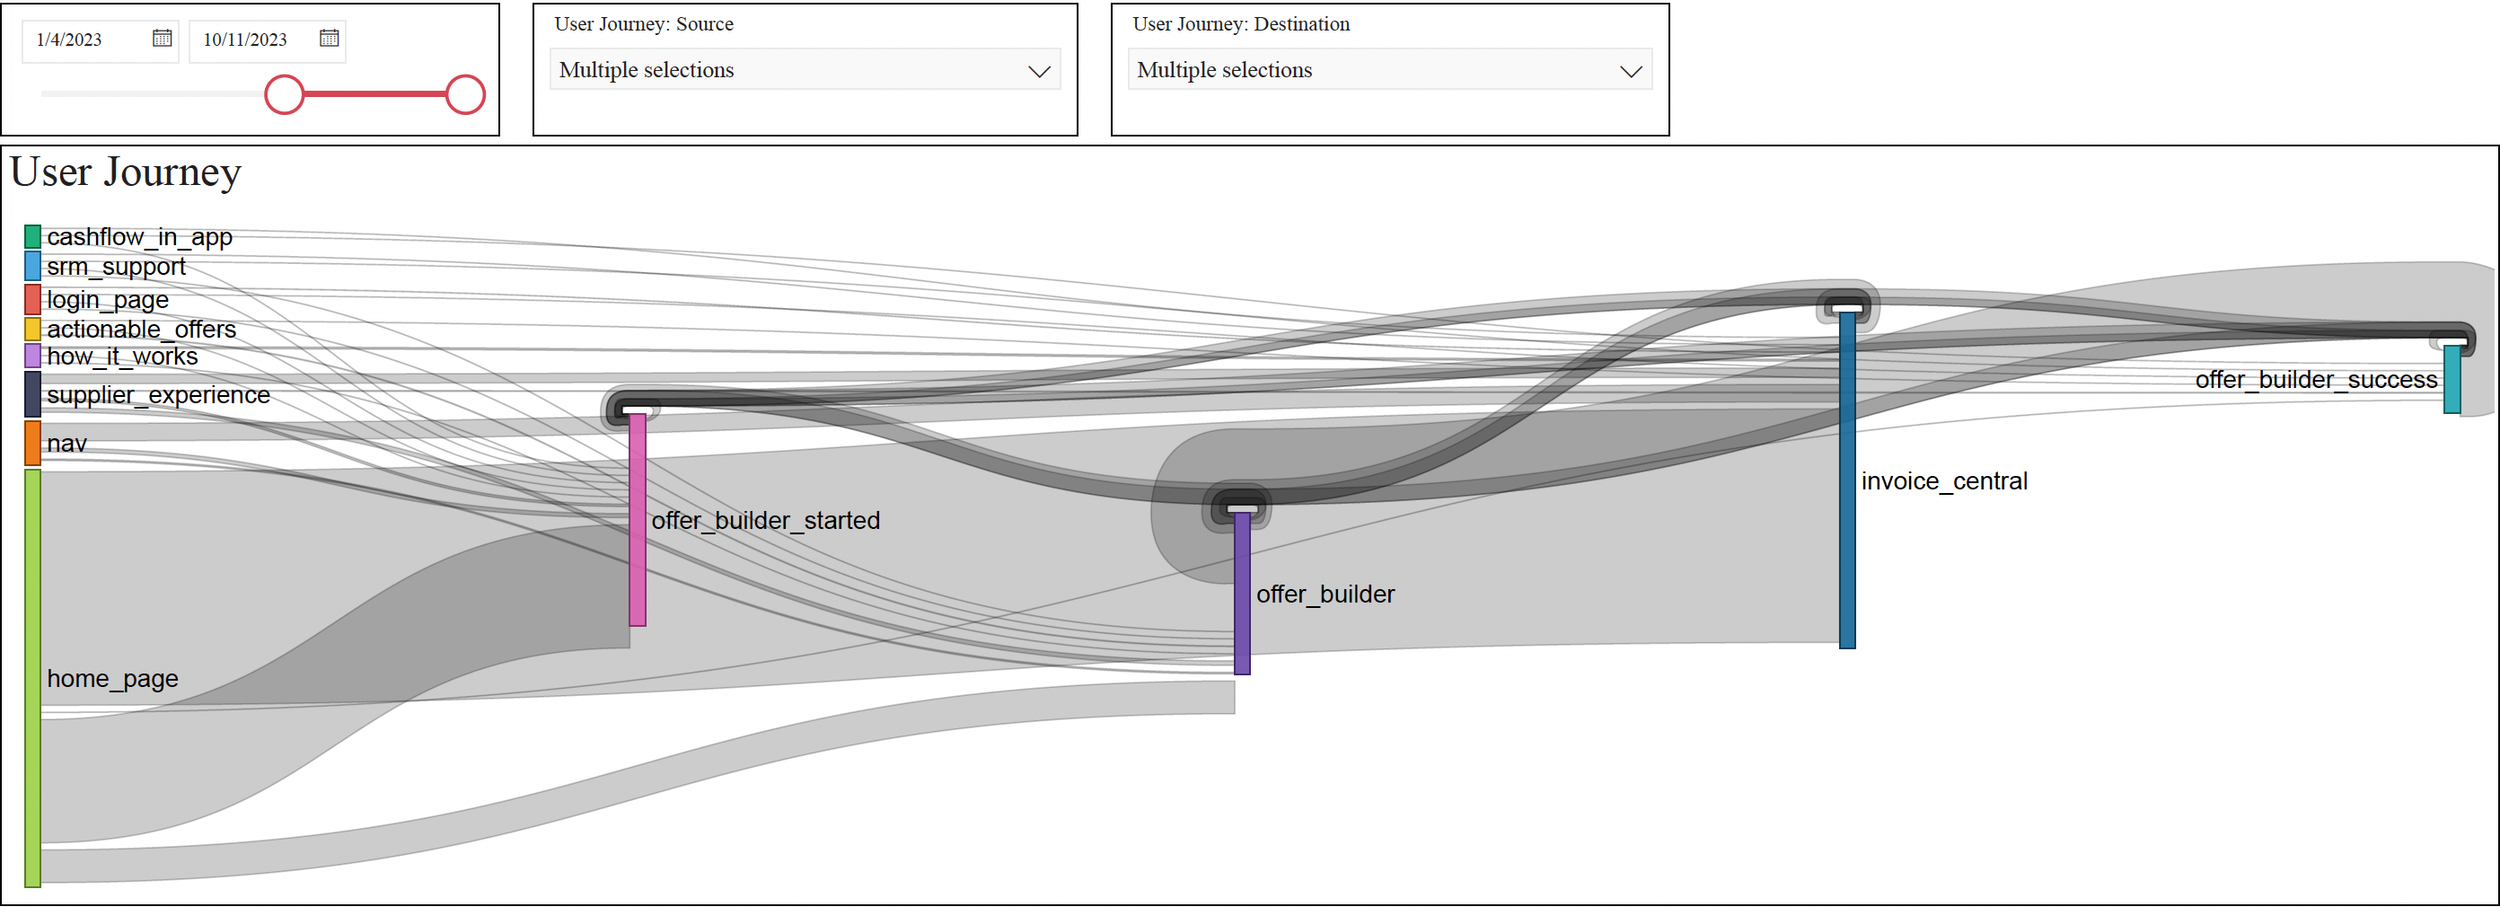
Stitching the Journey
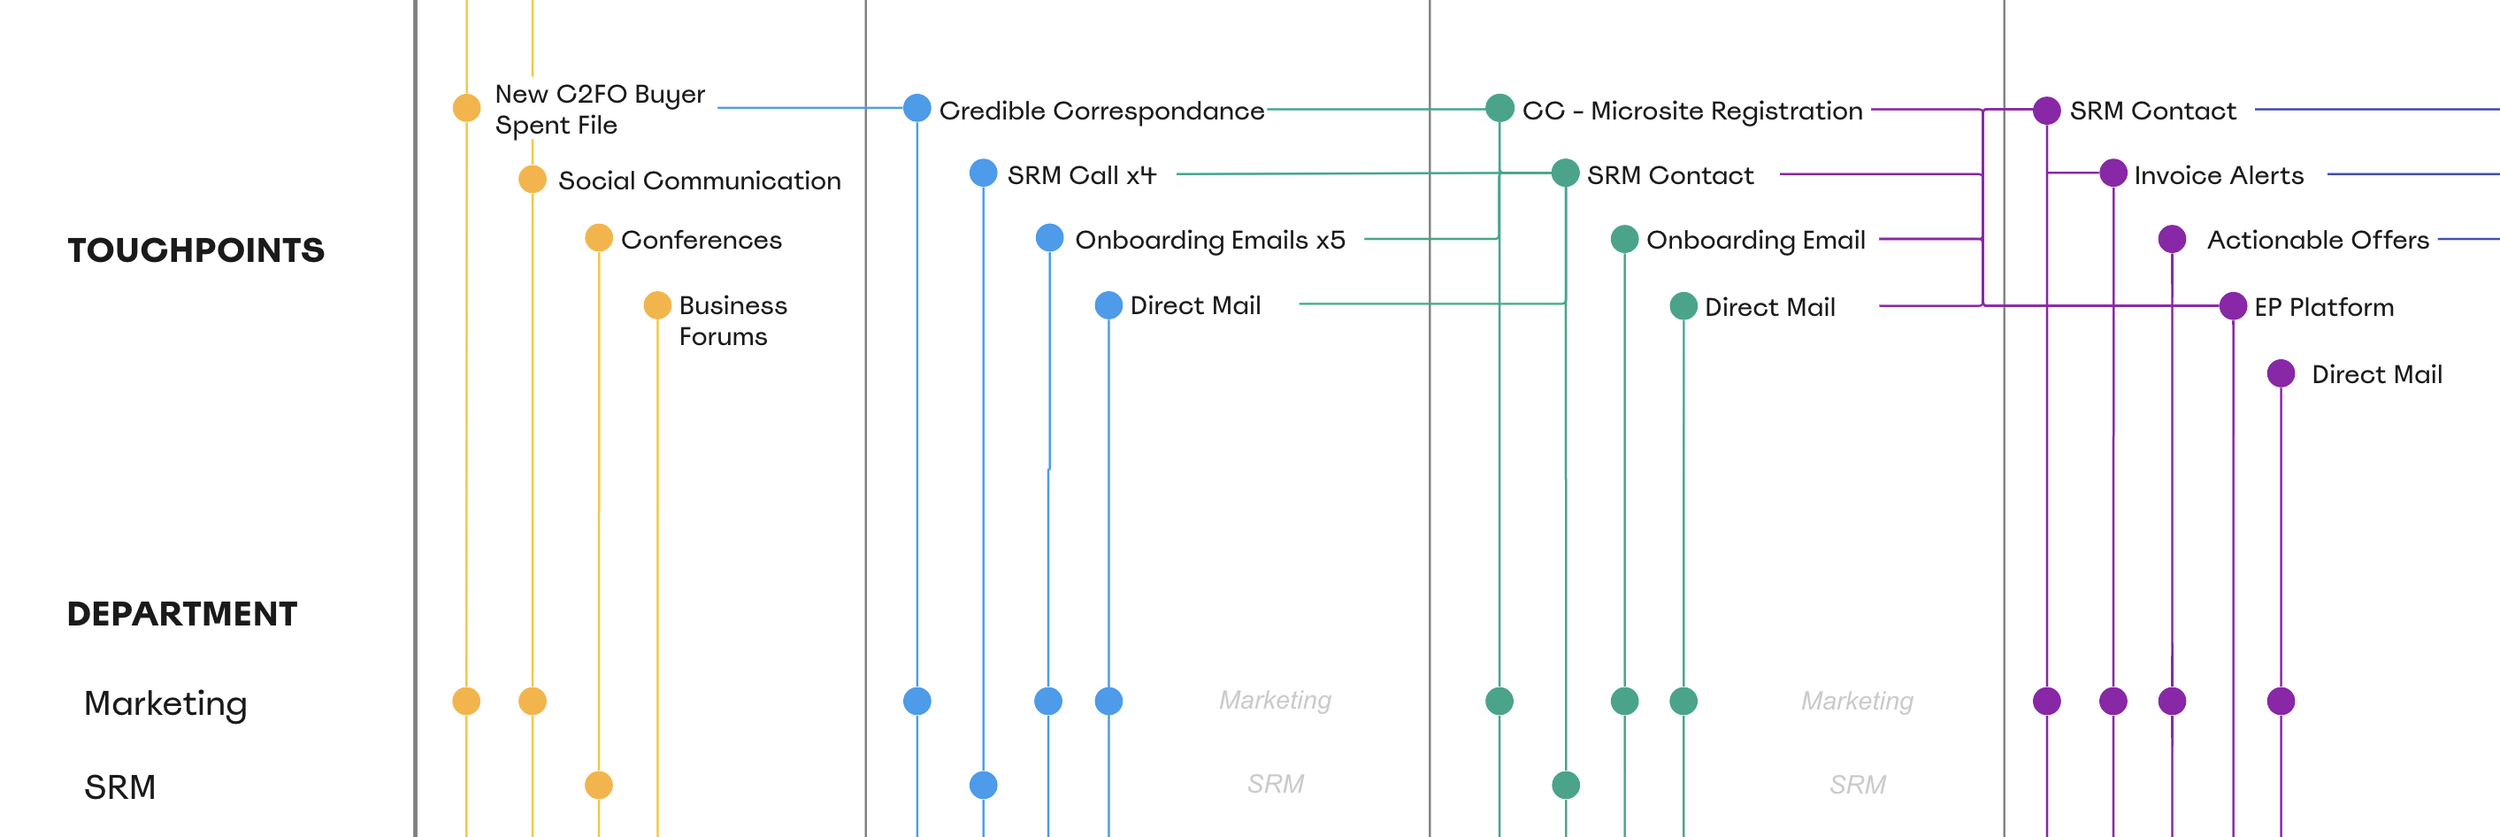
Data Mapping
Product & Engineering Feedback
Scheduled time with team leads to review each workflow and design feature, and gathered feedback for each section, feature, and component. We worked through the challenges, to determine feasibility and capacity for implementation.
Usability Testing & Validation
The designers worked with the UX research team to gather customer feedback and validate designs.
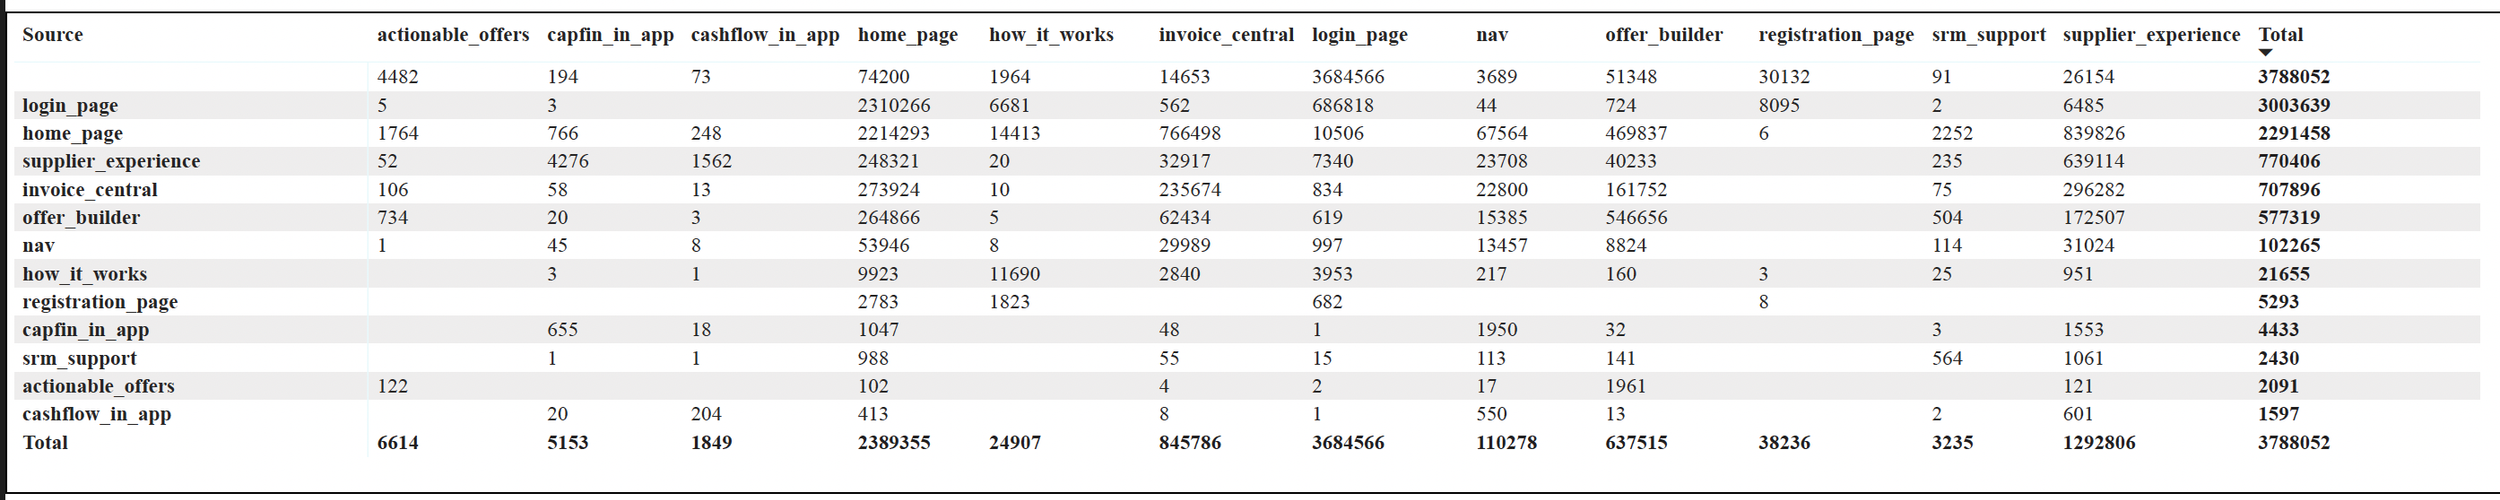
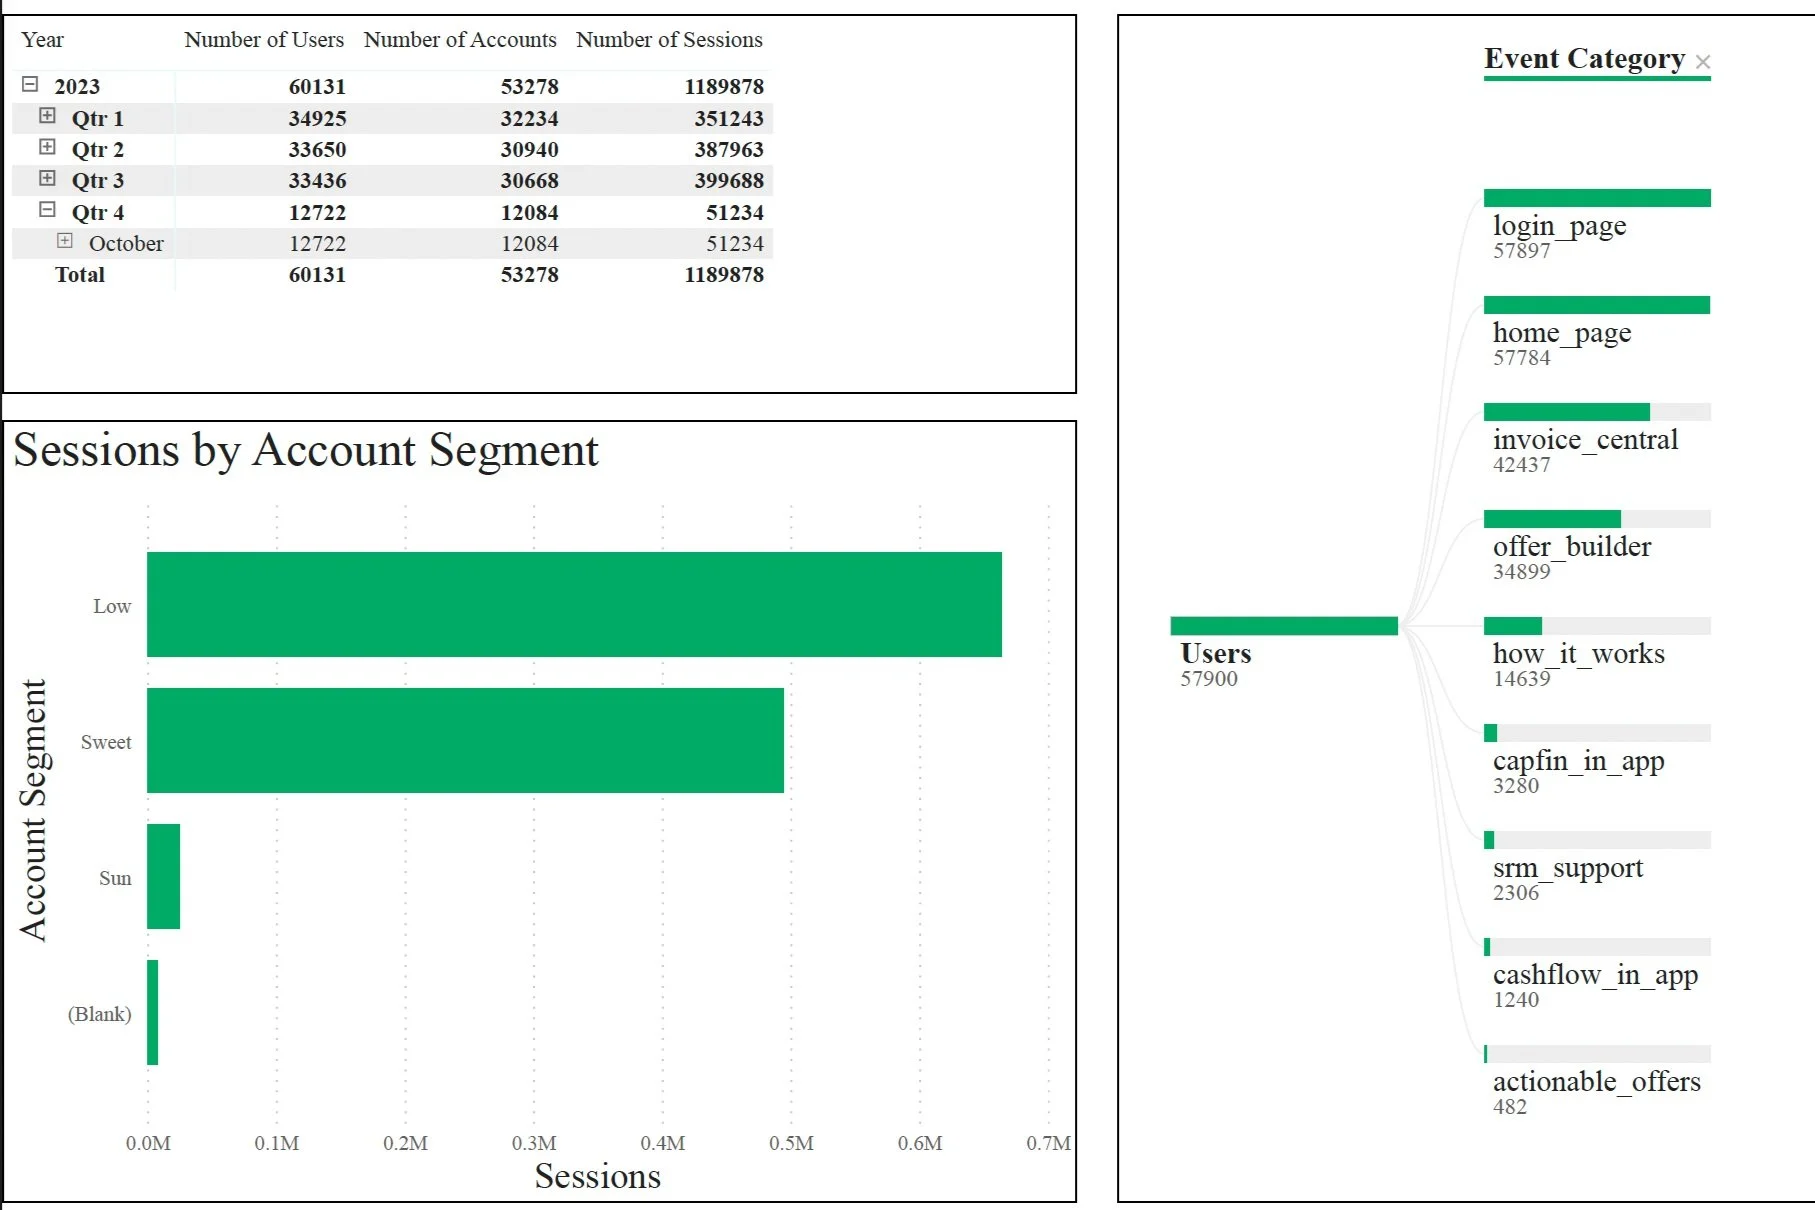
Existing Data Collection
With the help of our Business Analyst and data engineering, I mapped out the existing flows we wanted to track and created projections on how these updates would increase adoption, engagement, and participation.
Refinement Process
The native data visualizations from PowerBI did not allow for customization. These effort required me to work closely with the data analyst to ensure we were able to communicate the right amount of information and allow the dashboard to tell the story to the intended audience, our executive team. By doing so, we could help other teams make informed decisions, such as which roadmap projects to prioritize or which marketing campaigns to focus on.
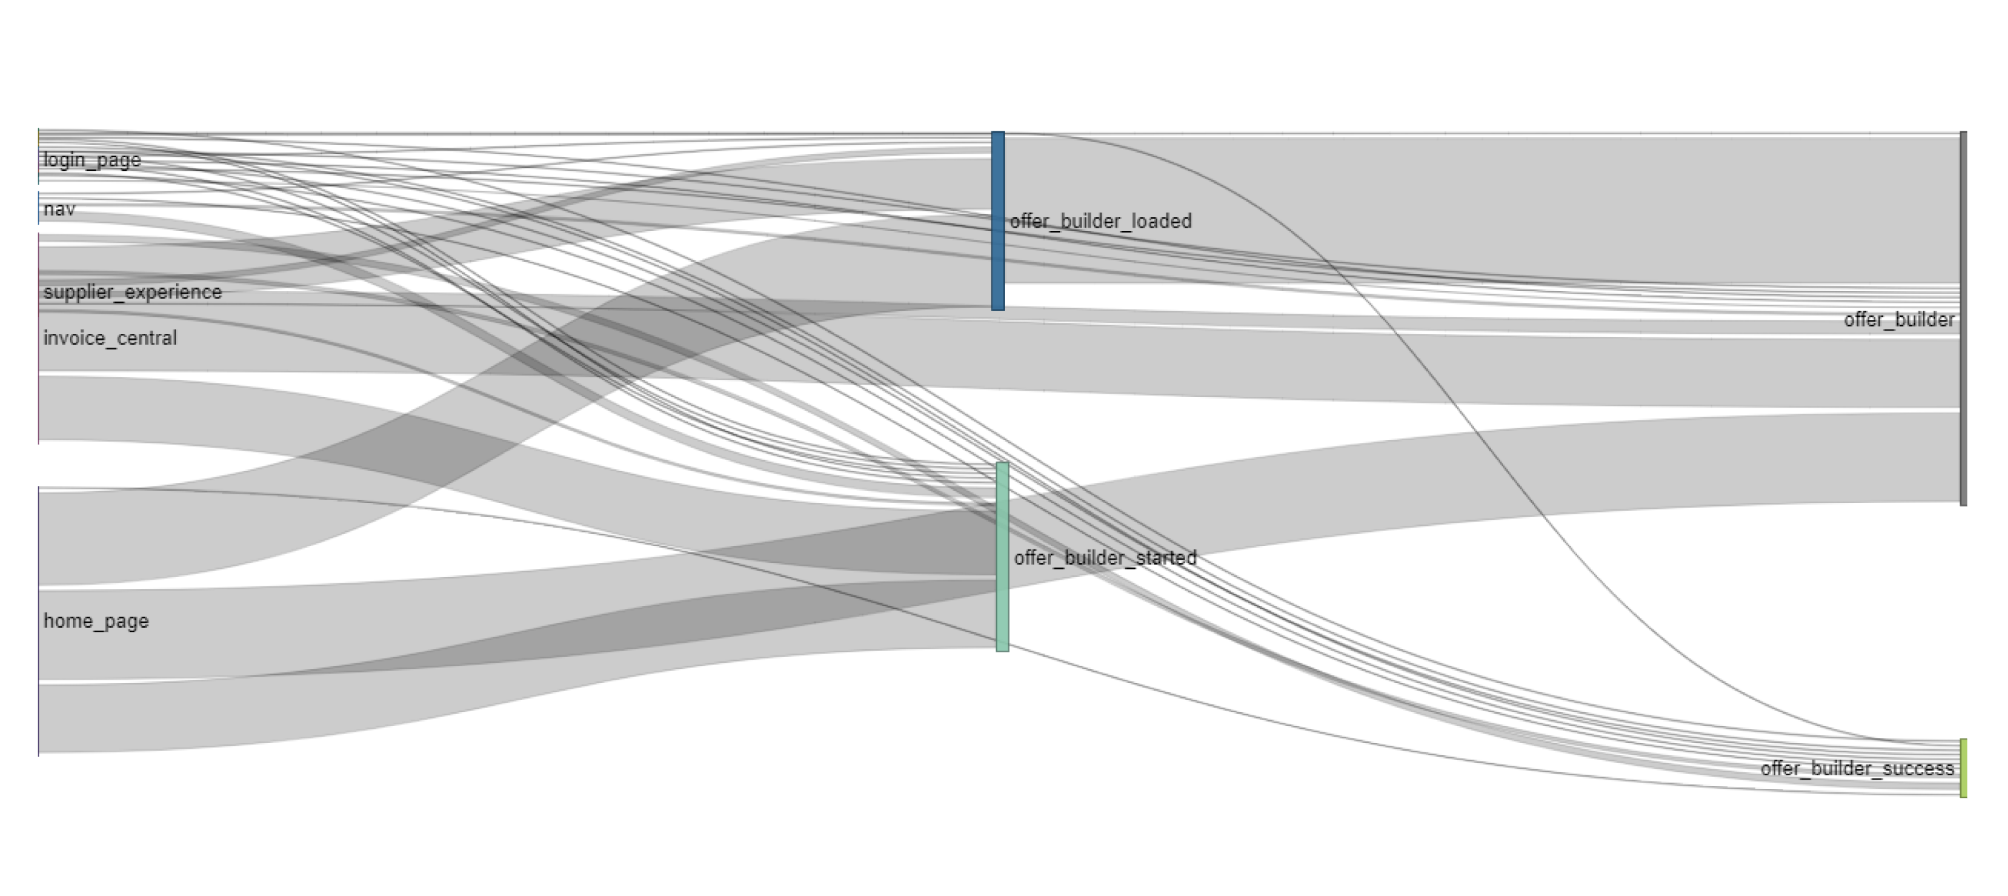
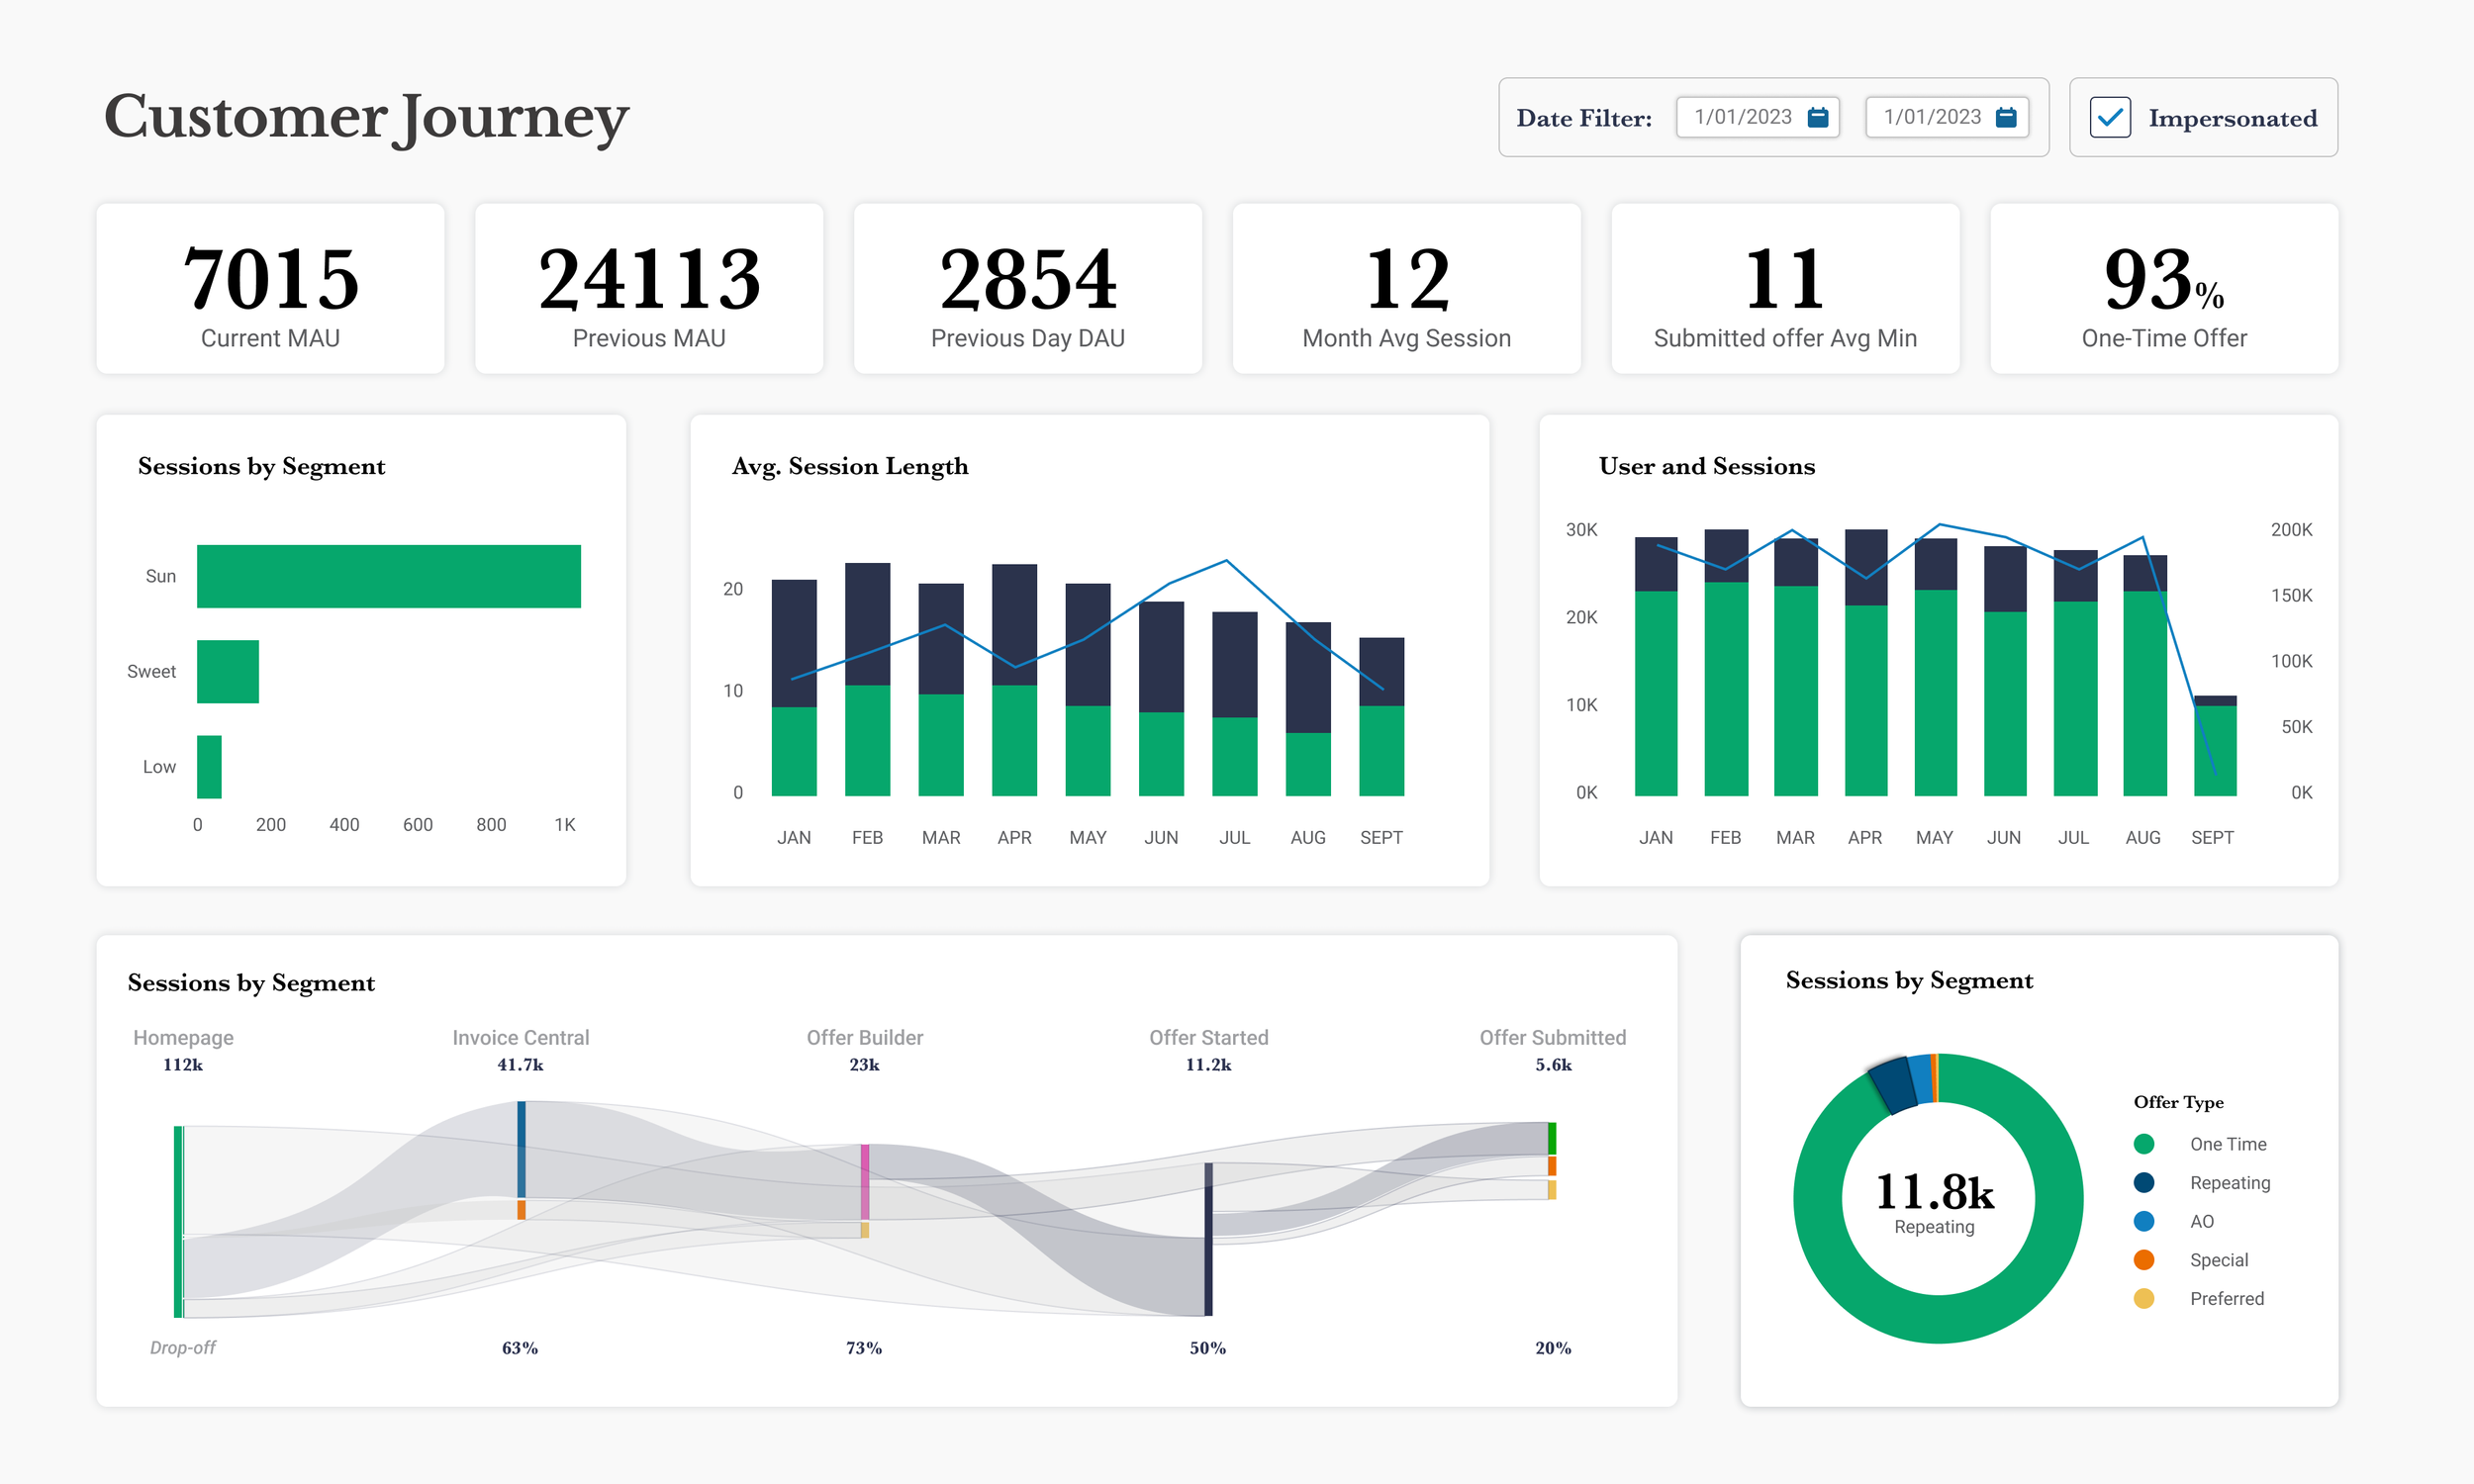
PowerBI Rendering
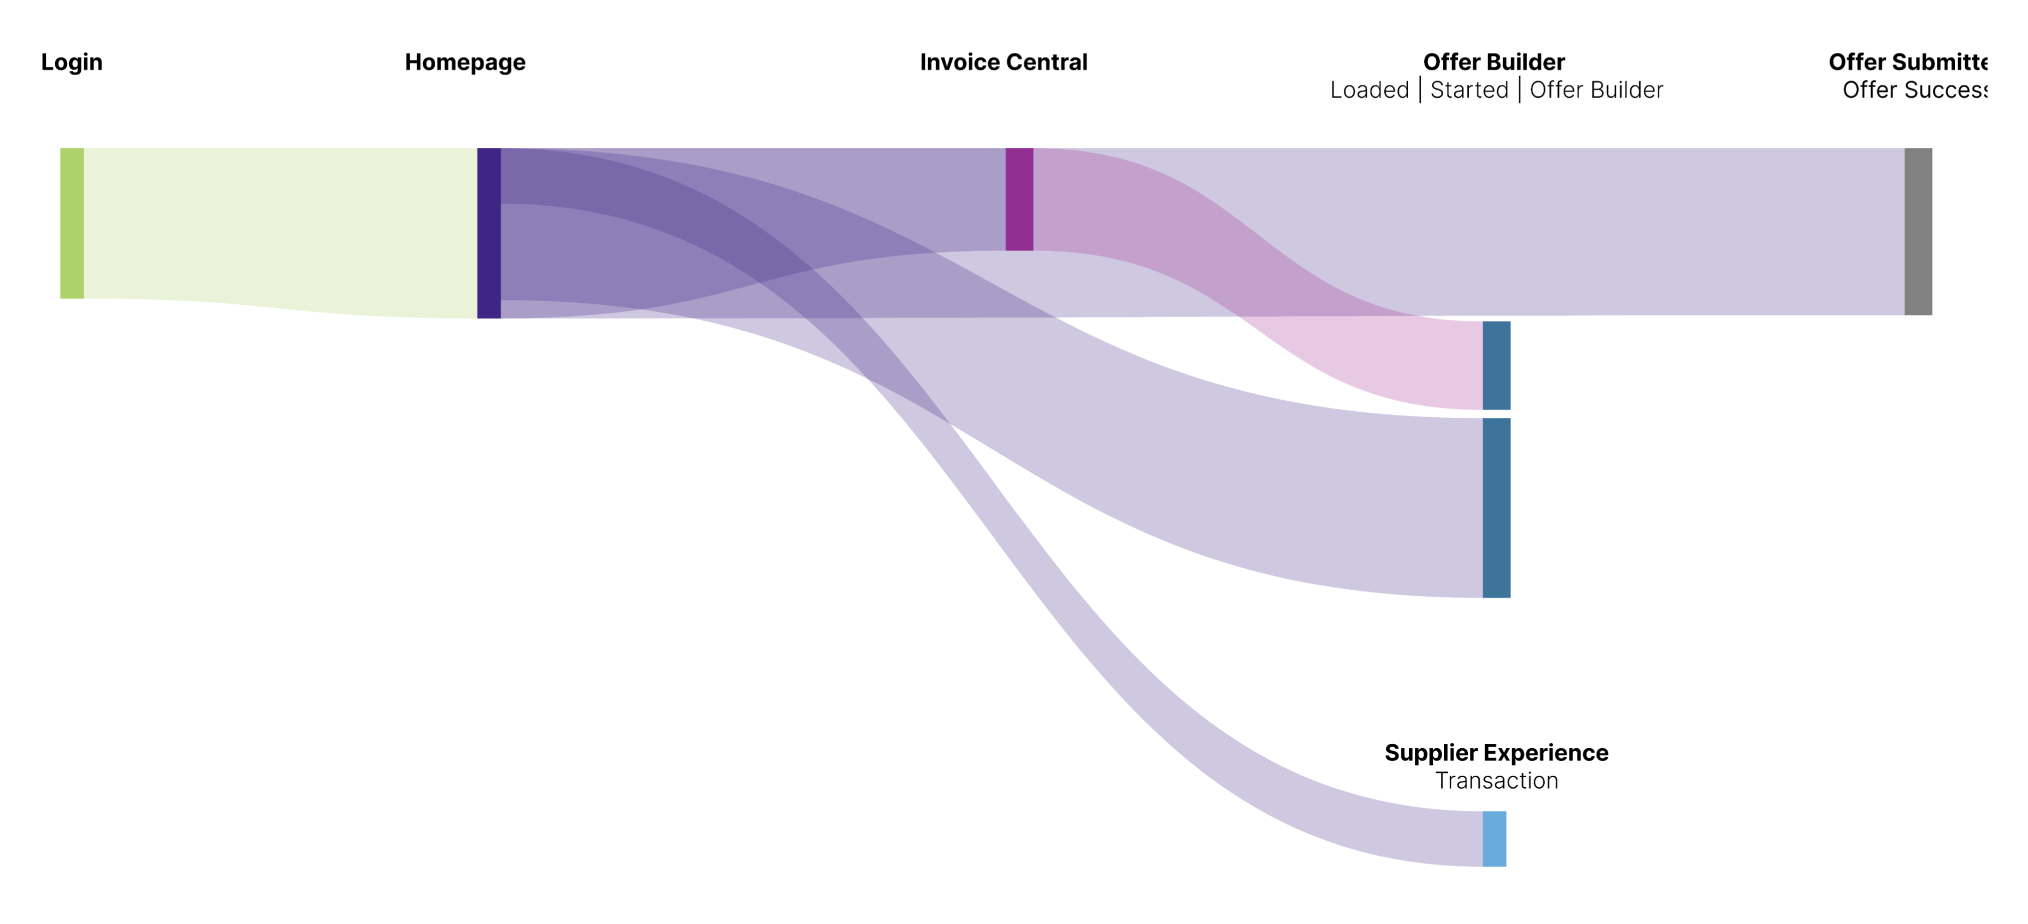
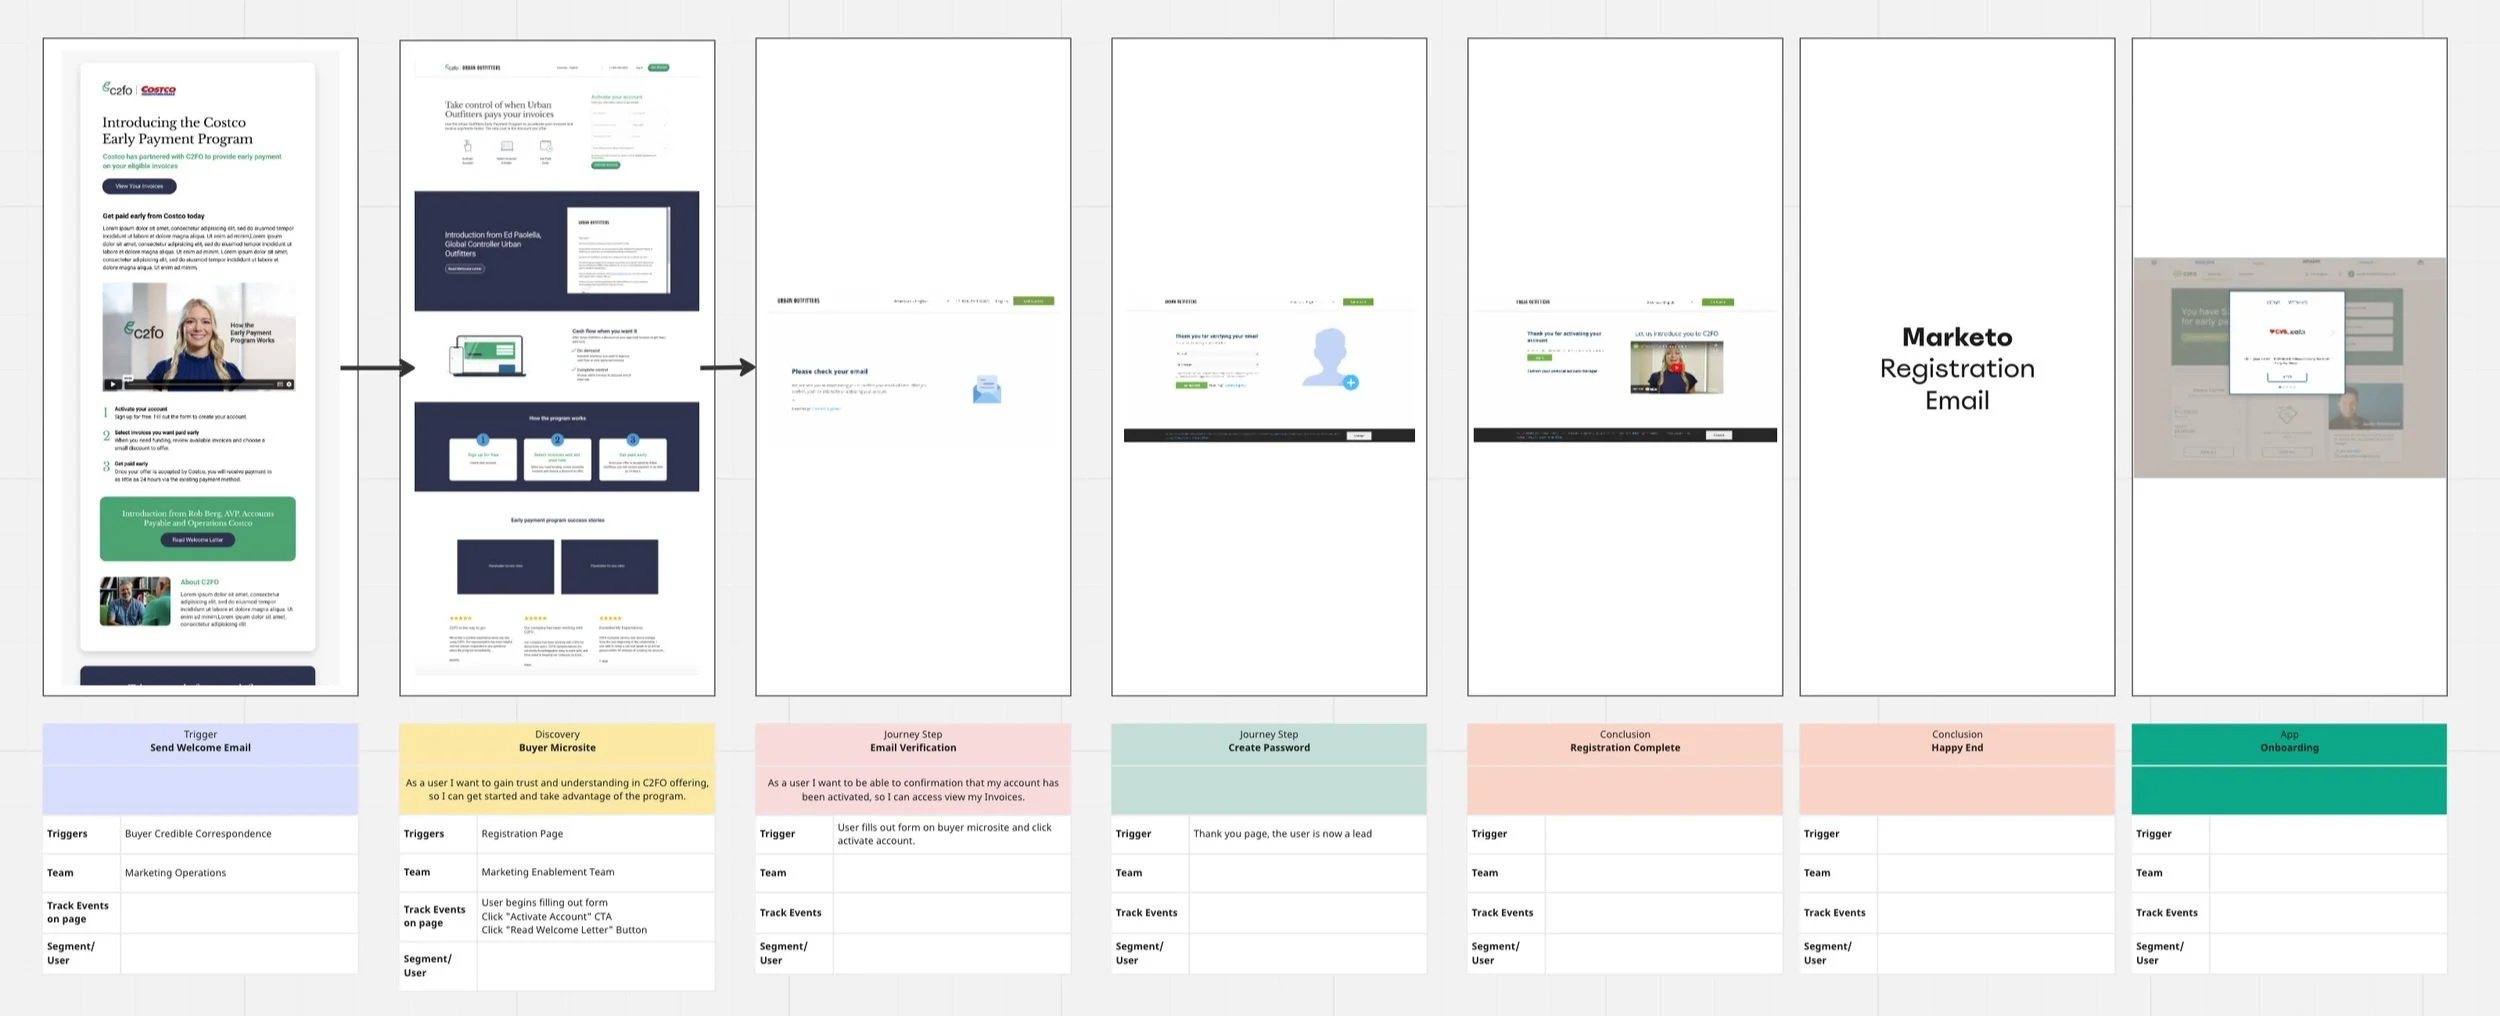
Figma Design Concept
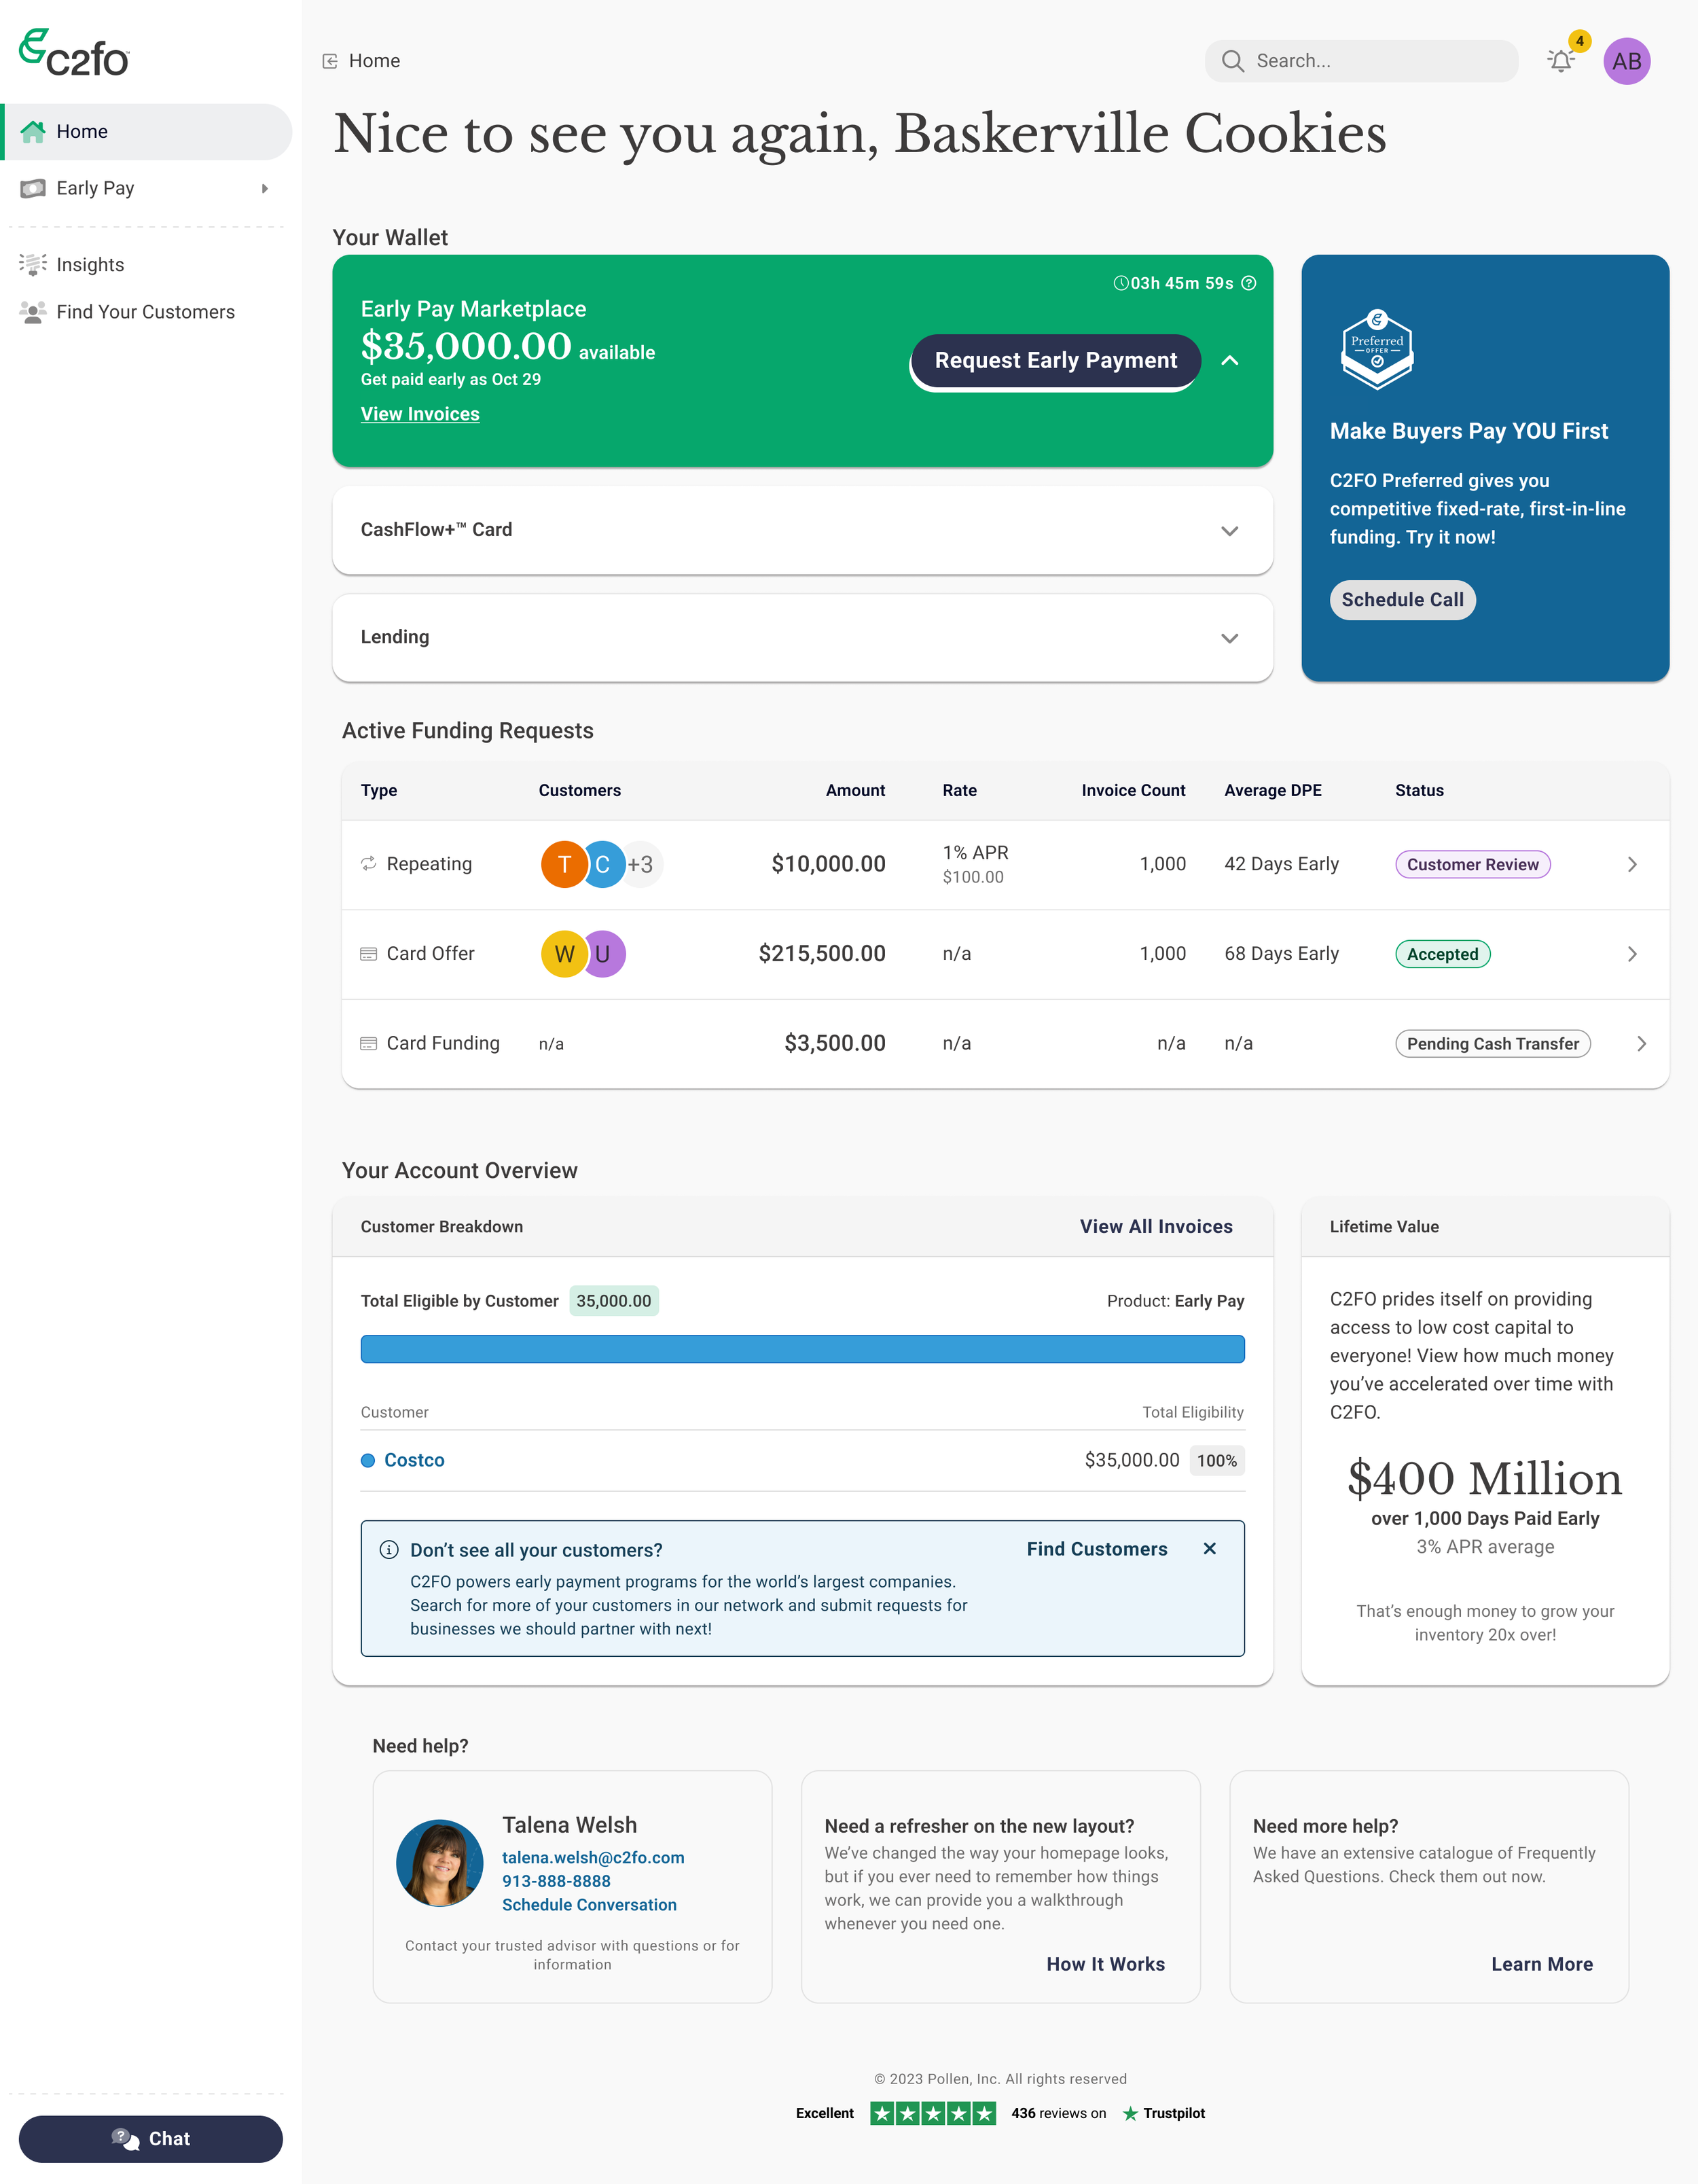
Initiative results
The main delivery team completed the ui updates and the majority of the new widgets on the screen.
Dev teams provided APIs to consume, ensure no other pages in the app break with the new implementation, and clean up track events. They assisted in delivering the notifications functionality and process to add new notifications in sync with the corresponding emails generated.
Marketing provided content for the marketing sections of the app, as well as any variable content we want to display in the Lifetime Value widget.
Sales provided an updated Talk track and training material.